How to change the tooltip behavior in Tableau for sheets with multiple cards

Tableau has two tooltip behaviors

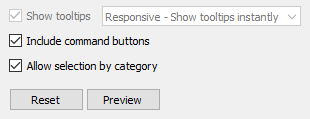
  1. Responsive – Show tooltips instantly
  2. On Hover – Show tooltips on hover

The default is Responsive. For workbooks published to Tableau Server, I find the behavior On Hover works best with the viz-in-tooltip feature.

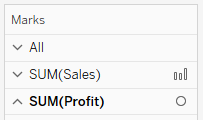
However, changing the tooltip behavior from Responsive to On Hover is complicated if there are multiple cards on the worksheet because Tableau only allows you change the tooltip behavior on the All card which then causes the tooltips to reset on all the other cards.

multiple_marks_cards
Sheet with multiple cards
disabled_tooltip_setting
Disabled tooltip setting on SUM(Sales) card

To avoid this it is possible to edit the .twb directly. To change the tooltip behavior for a worksheet called Complex Chart, follow these steps:

  1. Backup the .twb in case of errors.
  2. Open the .twb in Notepad++ (or another text editor) and search for the worksheet tag with the name attribute set to Complex Chart:
    worksheettag
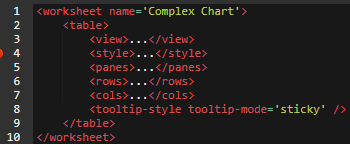
  3. Collapse the tags until you end up with something like this:
    worksheettag-responsive
  4. Before the closing table tag add in a tooltip-style tag with the tooltip-mode attribute set to sticky:
    workbooktags
  5. Save and close the .twb file. Re-open in Tableau and the tooltip behavior for the sheet Complex Chart will now be On Hover.

The tooltip-style tag with the attribute tooltip-mode=’sticky’ is what changes the tooltip behavior to On Hover for all the cards.

HTML Parsing/Web Scraping using Alteryx

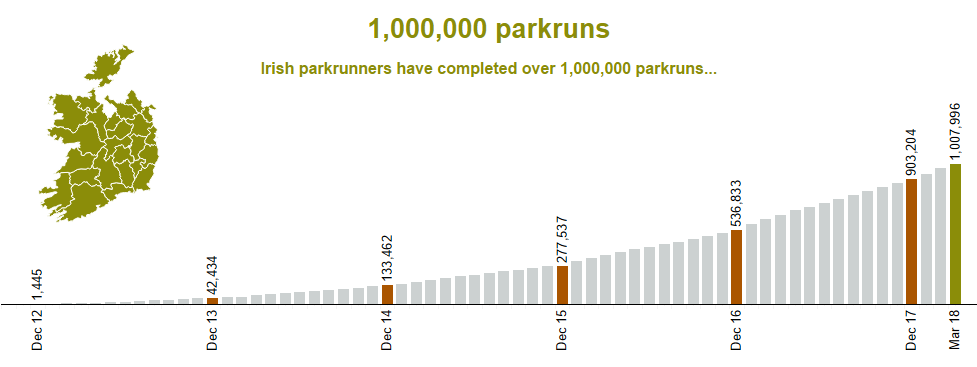
Parkrun Ireland (the free weekly timed 5km run) recently passed the 1,000,000 parkruns milestone. I wanted to take a look at how these runs had accumulated over the years. To do this I needed the event history for each parkrun course.

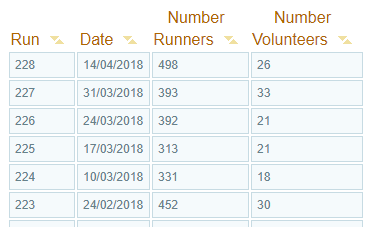
Each course displays its event history in a HTML table.
Event_History
I decided the quickest way to get this history for all 75 courses was to use Alteryx.

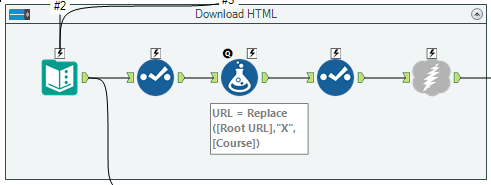
Step 1: Pass the URL to the Download tool which will output all the HTML.
Step1_Download
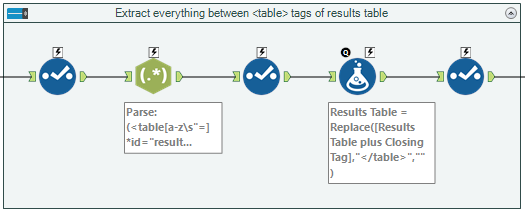
Step 2: Use the RegEx tool to isolate and extract just the HTML for the event history table.
Step2_HTMLTable
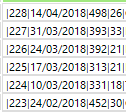
Step 3: Use the RegEx and Text to Columns tools to transform the HTML table into a pipe-delimited table.
Step3_PipeDelimitedTable
Step 4: Use the Text to Columns tool to split the rows into columns at the pipe (|) delimiter.
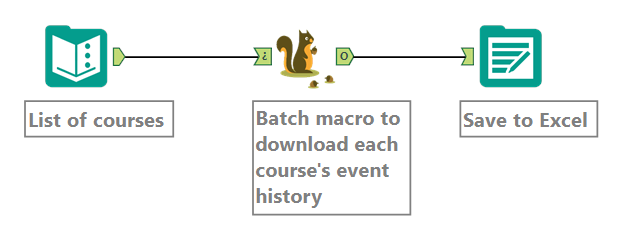
Step 5: Use the Interface tools to turn the workflow into a Batch macro which takes a list of courses as the input.
Workflow
You can check out the Tableau dashboard built using this data here on Tableau Public.
Tableau_Dashboard

Parsing PDFs using Alteryx – Use Case

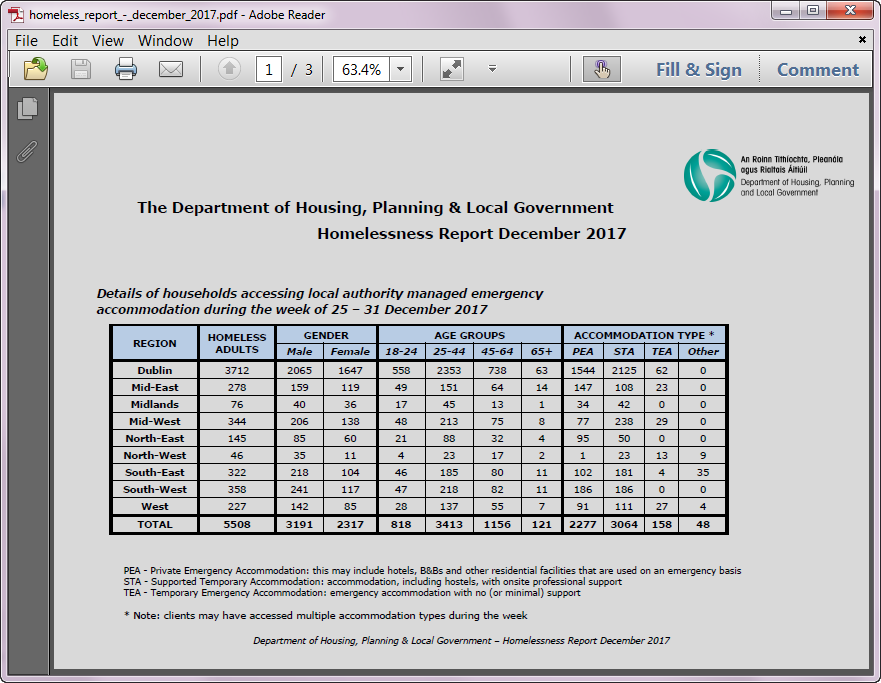
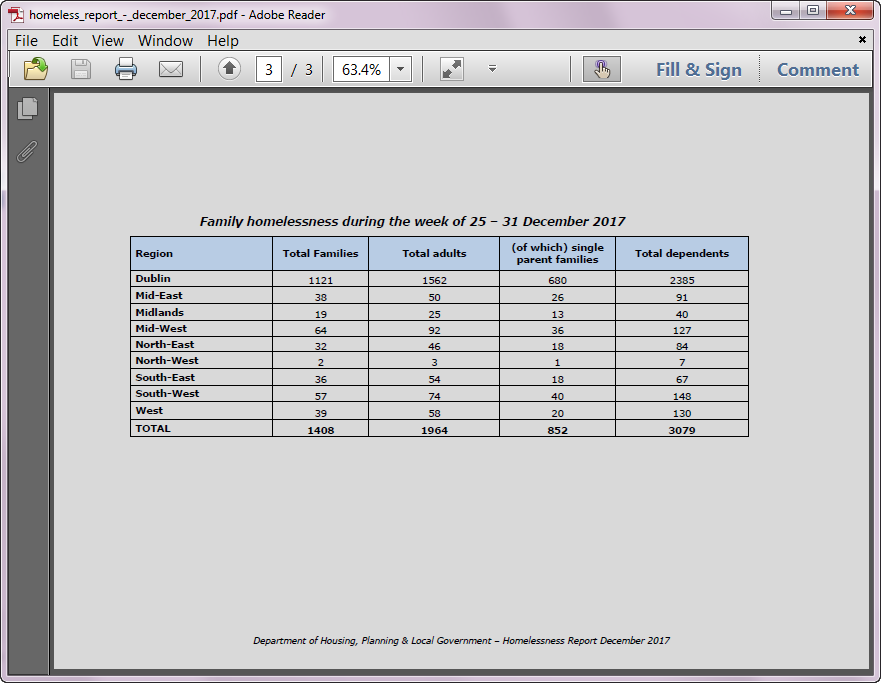
The Dept. of Housing publishes a PDF report every month on the number of people accessing emergency accommodation in Ireland. The report contains 2 main tables: one based on adults and one based on families.
Adults
Families Table
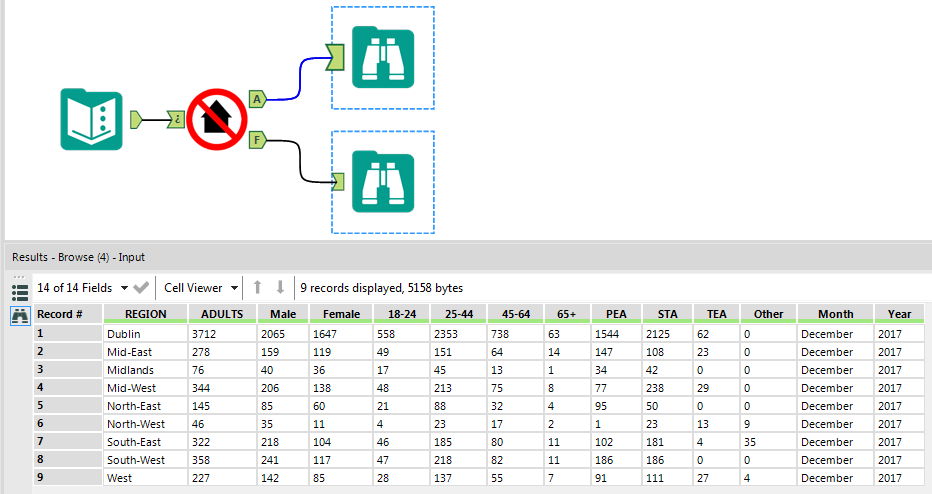
An Alteryx macro which extracts these 2 tables was built. The macro takes the full path of the PDF as an input and has 2 outputs: one for the adults table and one for the families table.
Alteryx Macro
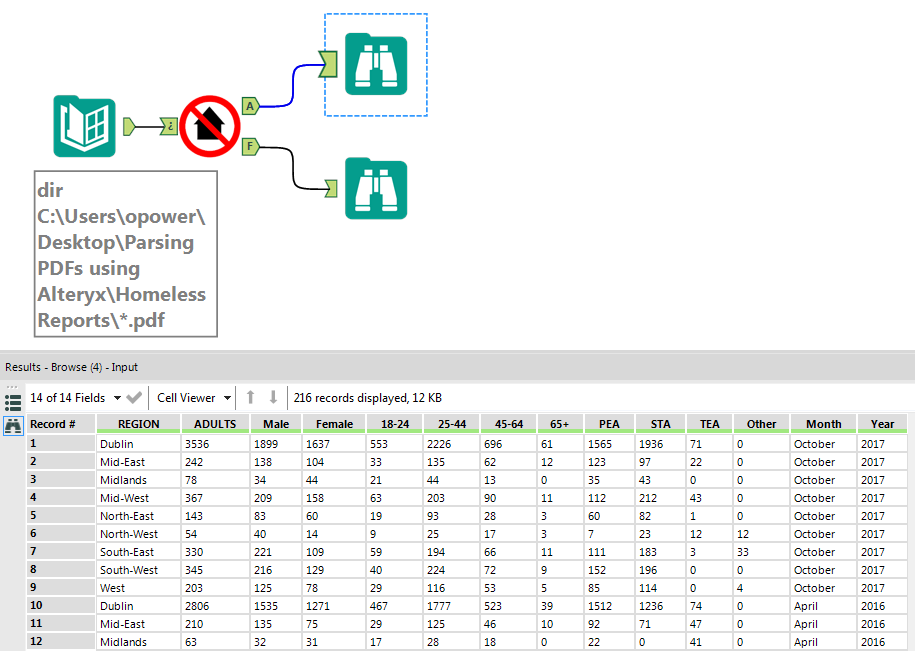
This macro is actually a batch macro which means it can be fed a list of PDFs to parse. The Directory tool is used to generate this list by pointing it at the folder in which all the monthly reports are saved.
Alteryx Macro - Multiple Files
A Tableau dashboard was then built to display the data extracted from 2 years of monthly reports. The dashboard can be viewed here on Tableau Public.
Tableau Public Dashboard
The batch macro which extracts the tables from the report has the following steps:
1. Extract the text from the PDF using the R tool and the R package pdftools. The output of this step is a single string for each page of the PDF.
2. Flag the pages containing the tables. This is based on knowing the titles of the tables.
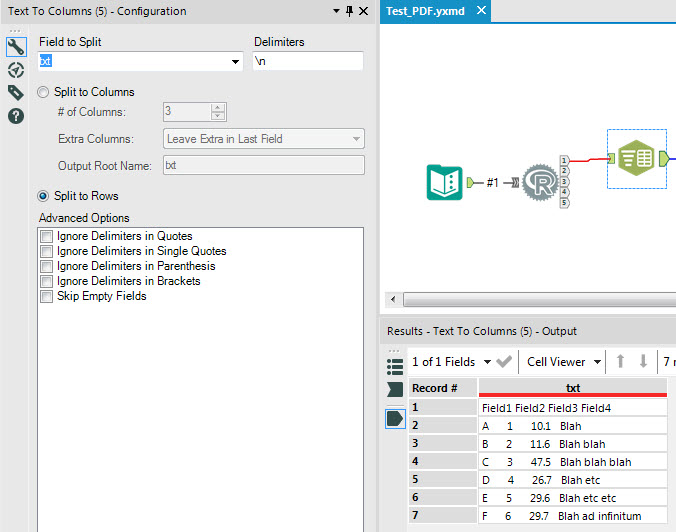
3. For these pages, split the string into rows at the \n delimiter using the Text to Columns tool.
4. Isolate the rows that correspond to rows of the tables (and not titles or footers).
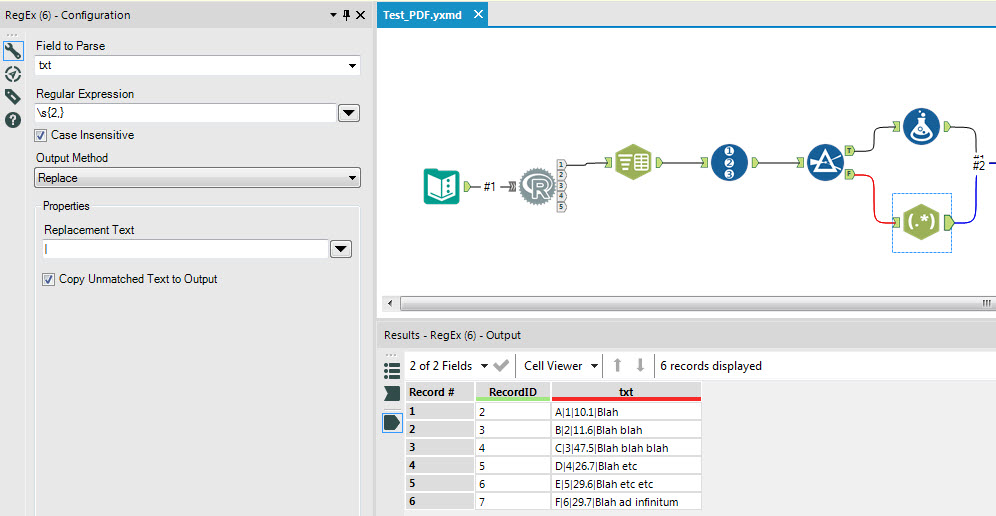
5. Use the Regex tool to replace spaces by pipes (|) and then use the Text to Columns tool to split the strings at the | delimiter.
My previous post covers this in more detail: Parsing PDFs using Alteryx (and a little R)

Parsing PDFs using Alteryx (and a little R)

Motivation
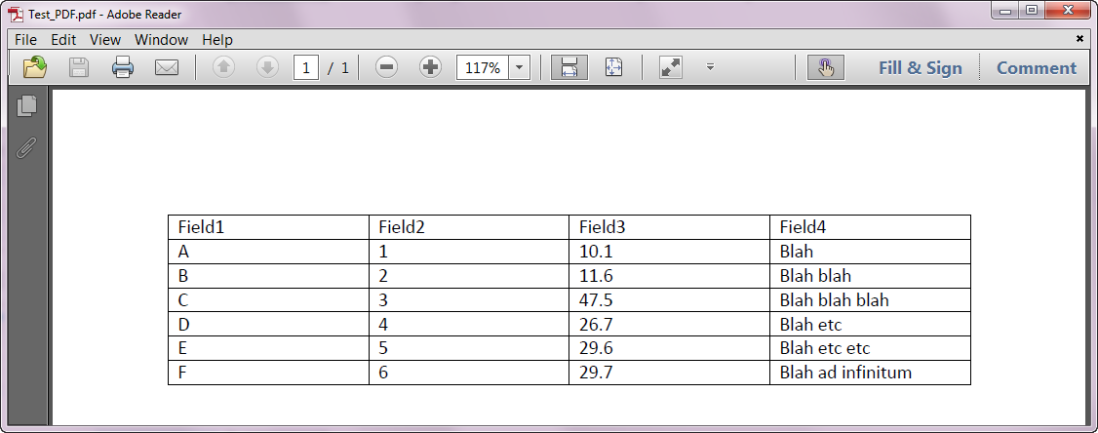
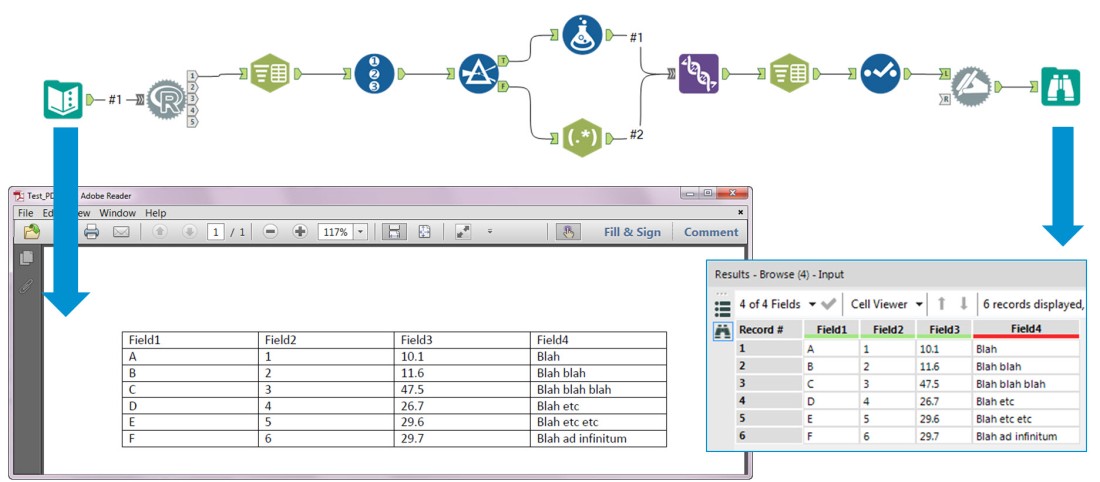
Suppose we have a PDF which contains a table and we would like to extract that table.
Table in PDF
The R package pdftools can extract text from PDFs, and Alteryx, which is a visually intuitive drag-and-drop data analysis tool, makes it very easy for R novices to include R code snippets as part of a workflow.
Step-by-step guide
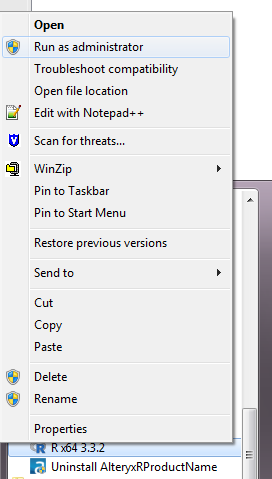
In order to build an Alteryx workflow which can extract text from PDFs, first install the packages pdftools and Rcpp. To do this, right-click on the R version which installed with Alteryx and select “Run as administrator”.
Run as Administrator
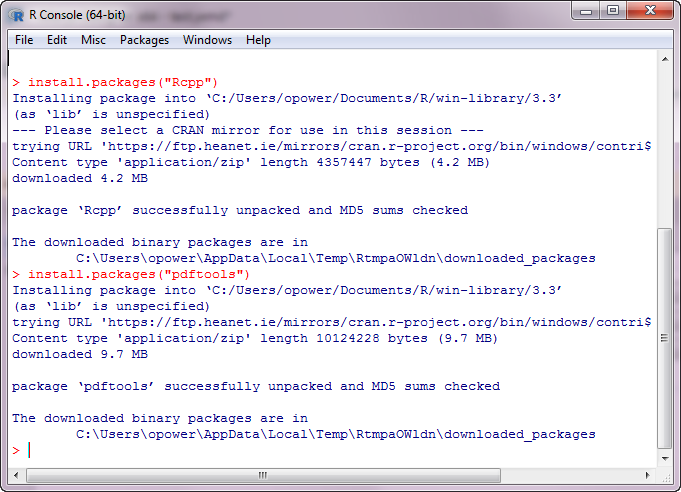
Now run the commands below to install/update the required packages.

install.packages(“Rcpp”)
install.packages(“pdftools”)

Run as administrator and install
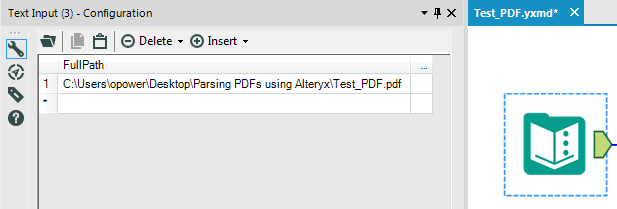
The Alteryx workflow starts with a Text Input tool which contains the full path of the PDF file.
Text_Input
Next the R tool is used to extract the text from the PDF. The code used in the R tool is below.

# read in the PDF file location which must
# be in a field called FullPath
data <- read.Alteryx("#1",mode="data.frame")

# Use pdf_text() function to return a character vector
# containing the text for each page of the PDF
txt <- pdftools::pdf_text(file.path(data$FullPath))

# convert the character vector to a data frame
df_txt <- data.frame(txt)

# output the data frame in steam 1
write.Alteryx(df_txt, 1)

Write_some_R
The output from the R tool is a single string which contains the extracted text. To parse this string, use the Text to Columns tool in Alteryx to split the string into rows at the newline (\n) character.
Text to Columns - Newline
To split out the table columns, use the Regex tool to replace sequences of 2 or more blanks by a pipe delimiter (|).
Regex
Finally use the Text to Columns tool to split the strings at the pipe delimiter and use the Dynamic Rename tool to take the column names from the first row.
Full Workflow
Reference
Alteryx Community | PDF Parsing in Alteryx using R

Using XACT_STATE in a CATCH block

The XACT_STATE function can be used in a CATCH block to decide whether to commit or roll back a transaction.

In the example below, the UPDATE statement raises an error and control is passed to the CATCH block. In the CATCH block, XACT_STATE is used to check that the transaction can be rolled back. In this case, the INSERT statement before the failed UPDATE statement is rolled back and CountyTown remains an empty table.

/* If XACT_ABORT is ON, an error will cause the entire
transaction to be terminated and rolled back. It is
recommended to set XACT_ABORT ON so that command timeouts
won't leave the transaction open. For the purposes of this
post XACT_ABORT is set to OFF to show how XACT_STATE can
be used to commit part of a transaction. */

SET XACT_ABORT OFF

IF OBJECT_ID('CountyTown','U') IS NOT NULL
	DROP TABLE CountyTown;
GO

CREATE TABLE CountyTown
(
	[County] NVARCHAR(10)
	,[Town] NVARCHAR(10)
);
GO

BEGIN TRY
	BEGIN TRANSACTION;
	
	/* succeeds */
	INSERT INTO CountyTown VALUES
	(N'Tipperary',N'Clonmel')
	,(N'Clare',N'Ennis');		
	
	/* fails - error occurs */
	UPDATE CountyTown
	SET [County] = N'This string is too long';	
	
	/* does not execute as control is
	passed to CATCH block */
	INSERT INTO CountyTown VALUES
	(N'Kerry',N'Tralee');
	
	/* would commit the transaction if 
	an error did not occur */
	COMMIT TRANSACTION;
END TRY
BEGIN CATCH
	/* rolls back the transaction
	if this is possible (i.e. if XACT_STATE is
	not equal to 0) */
	IF XACT_STATE()  0
	BEGIN
		PRINT N'Error encountered'
		PRINT N'Error Msg: '+ERROR_MESSAGE()+N' Line: '
                      +CAST(ERROR_LINE() AS NVARCHAR(10))
		PRINT N'Rolling back transaction'
		ROLLBACK TRANSACTION;
	END
END CATCH
GO

In the following example, XACT_STATE is used to commit the statements that executed before the error occurred; that is, the first INSERT statement is committed and the table CountyTown will contain 2 rows:

County Town
Tipperary Clonmel
Clare Ennis
/* If XACT_ABORT is ON, an error will cause the entire
transaction to be terminated and rolled back. It is
recommended to set XACT_ABORT ON so that command timeouts
won't leave the transaction open. For the purposes of this
post XACT_ABORT is set to OFF to show how XACT_STATE can
be used to commit part of a transaction. */

SET XACT_ABORT OFF

IF OBJECT_ID('CountyTown','U') IS NOT NULL
	DROP TABLE CountyTown;
GO

CREATE TABLE CountyTown
(
	[County] NVARCHAR(10)
	,[Town] NVARCHAR(10)
);
GO

BEGIN TRY
	BEGIN TRANSACTION;
	
	/* succeeds */
	INSERT INTO CountyTown VALUES
	(N'Tipperary',N'Clonmel')
	,(N'Clare',N'Ennis');		
	
	/* fails - error occurs */
	UPDATE CountyTown
	SET [County] = N'This string is too long';	
	
	/* does not execute as control is
	passed to CATCH block */
	INSERT INTO CountyTown VALUES
	(N'Kerry',N'Tralee');
	
	/* would commit the transaction if 
	an error did not occur */
	COMMIT TRANSACTION;
END TRY
BEGIN CATCH
	/* rolls back transaction
	if transaction is uncommittable */
	IF XACT_STATE() = -1
	BEGIN
		PRINT N'Error encountered'
		PRINT N'Error Msg: '+ERROR_MESSAGE()+N' Line: '
                      +CAST(ERROR_LINE() AS NVARCHAR(10))
		PRINT N'Rolling back transaction'
		ROLLBACK TRANSACTION;
	END
		
	/* commits the transaction
	if transaction is committable */
	IF XACT_STATE() = 1
	BEGIN
		PRINT N'Error encountered'
		PRINT N'Error Msg: '+ERROR_MESSAGE()+N' Line: '
                      +CAST(ERROR_LINE() AS NVARCHAR(10))
		PRINT N'Committing transaction'
		COMMIT TRANSACTION;
	END
END CATCH
GO
Filter on Rank in Tableau

Suppose you have a list of products and you have been asked to display product X and also the 3 products above X and the 2 products below X as ranked by sales. The solution allows the user to enter product X e.g. if the user enters “Milk”:
RankFilterMilk
And if the user enters “Broccoli”:
RankFilterBroccoli
And if the user enters “Yoghurt”:
RankFilterYoghurt
The trick is to first create a field called [Rank by Sales] which ranks the products by sales using the formula RANK(SUM([Sales Amount]),’desc’). Then create a field called [Selected Product Rank] which is non-zero only for the selected product using the formula:

IF LOOKUP(MIN([Product]),0) = [p.Selected Product] THEN
    [Rank by Sales]
ELSE
   0
END

The LOOKUP() function allows us to mix the aggregrates ([Rank by Sales]) and non-aggregates ([Product]). Finally create a field called [Filter for 3 above and 2 below] which evaluates to TRUE for the selected product and the 3 products ranked above and the 2 products ranked below the selected product:

(WINDOW_MAX([Selected Product Rank])>4
AND
[Rank by Sales]>=(WINDOW_MAX([Selected Product Rank])-3)
AND
[Rank by Sales]<=(WINDOW_MAX([Selected Product Rank])+2))
OR
(WINDOW_MAX([Selected Product Rank])<=4
AND
[Rank by Sales]<=6)

The expression WINDOW_MAX([Selected Product Rank]) returns the rank of the selected product. Make sure that all the table calculations are computed using Table(Down).

Excel User DSN Error

In a previous post, I described how to set up an ODBC data source on your machine for use in an Excel workbook (Import Data into Excel using a SQL Query). Now if you send this workbook to your colleagues and they try to refresh the data, they are likely to get the following error message:

[Microsoft][ODBC Driver Manager] Data source name not found and no default driver specified.

This is because your colleagues also need to set up the data source on their machine (step 1 of Import Data into Excel using a SQL Query). They will also need to edit the connection string in the Excel workbook. To do this, open the workbook and go to “Data”, and then “Connections”.
Excel Data Tab
Select the connection in the dialog which pops up and then click on “Properties”.
Excel Connections Dialog
In the “Properties” dialog, click on the “Definition Tab”. The connection string, which specifies information about the data source and how to connect to it, can now be seen. Your colleague will need to edit the user ID (UID) and workstation ID (WSID). They will also need to edit the DSN and Description fields if they entered a different name and description when connecting to the data source. Your colleague can find their WSID, or computer name, under System on the Control Panel.
Excel Connection Properties

Import Data into Excel using a SQL Query

(Excel 2010, Windows 7)
Follow the steps below if you want to import data into Excel from a SQL Server database using a SQL query.
Step 1: Create the data source on your machine.
Type “ODBC” into the Start Menu search and then click on “Data Sources (ODBC)”.
ODBC
The ODBC Data Source Administrator should open.
ODBC Admin
Click on “Add” and then enter a Name and Description for the SQL Server which you wish to connect to.
ODBC Admin
When you have successfully created your data source, you should see it listed as a user DSN (Data Source Name).
ODBC Admin
Step 2: Connect to the data source from within Excel.
Open Excel. Click on the “Data” tab, then “From Other Sources” and finally “From Microsoft Query”.
Excel Data Tab
Select the data source you created in step 1, un-tick “Use the Query Wizard to create/edit queries” and then click OK.
Excel Source
Close the “Add Tables” dialog which pops up, and then click on the “SQL” button in the “Microsoft Query” dialog.
Excel Source
Paste your SQL into the “SQL” dialog which pops up.
SQL Query
Click OK and then click OK again when asked “SQL Query can’t be represented graphically. Continue anyway?” Finally, click on the “Return Data” button to return the data to an Excel sheet.
Return Data

How to write a query that returns a list of numbers in T-SQL

Suppose you want to write a query that returns the integers from 0 to 4. As shown on stackoverflow a recursive common table expression (CTE) can be used. A recursive CTE includes references to itself:

WITH Numbers
AS
(
-- anchor member
SELECT 0 AS Number
-- set operator
UNION ALL
-- recursive member
SELECT Number + 1 FROM Numbers WHERE Number < 4
)
SELECT Number FROM Numbers;

which outputs

0
1
2
3
4

Here is how the list is created:
Step 1: The anchor member query runs and returns 0.
Step 2: Since 0 is less than 4, the recursive member query adds 1 to 0 and returns 1.
Step 3: Since 1 is less than 4, the recursive member query adds 1 to 1 and returns 2.
Step 4: Since 2 is less than 4, the recursive member query adds 1 to 2 and returns 3.
Step 5: Since 3 is less than 4, the recursive member query adds 1 to 3 and returns 4.
Step 6: Since 4 is not less than 4, the recursive member query returns NULL and the loop terminates.

Using a variable with the TOP clause

Suppose you want to declare a variable and use that variable with the TOP clause. The following SQL will return an error message:

DECLARE @numberRows INT = 5;

SELECT TOP @numberRows * 
FROM [mydb].[myschema].[mytable];

Msg 102, Level 15, State 1, Line 3
Incorrect syntax near ‘@NumberRows’.

The solution is to use brackets around the variable in the TOP clause:

DECLARE @numberRows INT = 5;

SELECT TOP (@numberRows) *
FROM [mydb].[myschema].[mytable];